EHIST_DISP - Visualizing speech corpus energy histogram statistics
As part of the Babel program, I developed some tools to investigate the low-level acoustic statistics of the different recordings, particularly looking at the grouping by environment type. This is a release of these tools.
The analysis grew out of trying to capture some of the novel distortions that came across perceptually as a poor cellphone channel, or aggressive noise/VAD gating. The tools produce two main plots: a 2D histogram of the dB energy levels in each frequency band, and a plot of the covariance of energy in different frequency bands.
The subband energy histograms frequently reveal multiple modes - effectively two noise floors, one for the actual signal being transmitted, and a lower noise floor from the "side tone" substituted when the cellphone codec has decided not to transmit any signal (for instance, because no far-end voice is detected).
The covariance plots can reveal substantial correlation across many energy bands because they are all being switched on or off with such a gating scheme, or weaker correlations that can arise from multi-band gating.
Also the plots can reveal problems like signals with strong narrowband noise (unexpected high-value modes in energy histogram), or signals with muffled high frequencies (low upper percentile towards the right of the histogram. But there are a lot of complex patterns, particularly in the covariance plots, that I don't yet fully understand. If you have insights, please let me know!
Contents
- Prerequisites
- Word Error Rate distributions - Bar graphs
- WER breakdowns across multiple languages
- Feature calculation
- Energy histogram plots - Whole corpora
- Energy histograms pooled across envType conditions
- Energy histograms of individual utterances sampled from one condition
- Energy histograms of specific utterances
- Installation
- Changelog
- Acknowledgment
Prerequisites
The code expects to find the demographics.tsv files for each of the datasets in a subdirectory reference_materials, in files named CORPUS-demographics.tsv, e.g. BP_101-demographics.tsv.
In that same directory, the tools will look for a file called CORPUS-dev.ctm.sys, which is a sys file generated by the NIST scoring tools. These are used to generate the WER numbers reported (for the error bar graphs, or stamped on the energy histograms of individual utterances).
Word Error Rate distributions - Bar graphs
This simply reads the WER numbers from the sys files, and plots them broken down by then envType condition from the demographics file.
% Plot the envType WER breakdown for one corpus as bars
corpus = 'BP_101';
usebars = 1;
randomize = 0;  % don't randomize the data!
subplot(121)
analyze_conditions(corpus, randomize, usebars);
% Box-whisker plots
subplot(122)
usebars = 0;
analyze_conditions(corpus, randomize, usebars);

WER breakdowns across multiple languages
% Plot for all the BP languages
corpora1 = {'BP_101', 'BP_104', 'BP_105', 'BP_106', 'BP_107'};
analyze_conditions(corpora1, randomize, usebars);

Feature calculation
These plots use pre-calculated feature files. This has to be run first. It reads from the archive, and writes to a subdirectory off the CWD.
% llps = {'BP_101','BP_104','BP_105','BP_106', 'BP_107', 'OP1_102', 'OP1_103', 'OP1_201', 'OP1_203', 'OP1_206'};
% for i = 1:length(llps); llpp{i} = ['/u/drspeech/data/swordfish/corpora/BABEL_', llps{i}, '_LLP/conversational/training/audio']; end
% tic; calc_ehist_ftrs(llpp); toc
% % The scripts assume the features will be found in
% % corpora/BABEL_<corpus>_LLP.  You may need to move them
% !mv ftrsout/u/drspeech/data/swordfish/corpora .
Energy histogram plots - Whole corpora
% Top-level summary energy histograms across different languages
% Pass a cell array of corpus names
corpora1 = {'BP_101', 'BP_104', 'BP_105', 'BP_106', 'BP_107'};
disp_lp(corpora1);
BP_101: 120 utterance feature files found
BP_104: 136 utterance feature files found
BP_105: 127 utterance feature files found
BP_106: 146 utterance feature files found
BP_107: 132 utterance feature files found

Energy histograms pooled across envType conditions
% Single language broken out by envType conditions
disp_lp('BP_101');
BP_101: 120 utterance feature files found

Energy histograms of individual utterances sampled from one condition
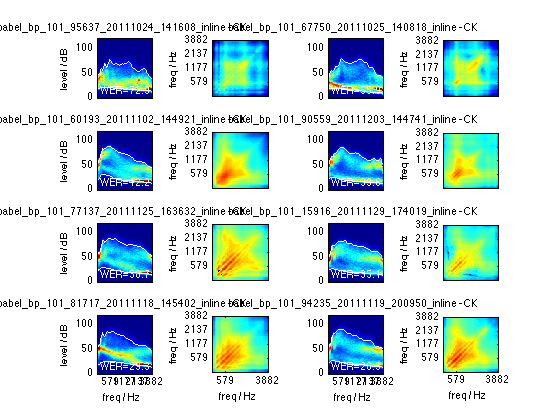
% Individual utterances for a single condition, sorted by WER if available
disp_lp('BP_101_CK'); % Initials of envType: 'CK', 'PP', 'S',
                      % 'HOL', 'M' etc.
BP_101: 120 utterance feature files found
Energy histograms of specific utterances
% Plot individual utterances - pass IDs as a cell array
disp_lp({'BABEL_OP1_201_10019_20130527_022947_inLine','BABEL_OP1_203_10188_20130220_225432_inLine'});
ASR results file reference_materials/OP1_201-dev.ctm.sys not found
ASR results file reference_materials/OP1_203-dev.ctm.sys not found

Installation
All sources are in the package ehist-v0.1.zip.
You'll also need my audioread function (not to be confused with the one introduced in Matlab R2013b) which will read Sphere audio files.
Feel free to contact me with any problems.
Changelog
% 2014-01-09 v0.1 Initial release
%
Acknowledgment
This work was supported by IARPA under the BABEL program via a subcontract from the ICSI-led team Swordfish.
Last updated: $Date: 2014/01/10 21:05:46 $ Dan Ellis dpwe@ee.columbia.edu