Table of Contents
DeepComposer
| Authors | Anna Aljanaki, Stefan Balke, Ryan Groves, Eugene Krofto, Eric Nichols |
| Code | Github Link |
Summary
- Collect several symbolic song datasets, with melody and possibly chords
- Represent data in a common vector format appropriate for input to a neural net
- Develop a Long Short-Term Memory (LSTM) architecture for generation of melody/chord output.
- Goal: Given a melody and chord sequence, generate melody with chords.
- Make music!
- Hopes: Bias the network by training it with different combinations of music (e.g., ESAC + WJD = Folk songs with jazz flavour)
Possible Datasets
- Temperley's Rock Corpus
- 200 songs
- Essen folk song collection: http://www.esac-data.org/data/
- WeimarJazzDatabase: http://jazzomat.hfm-weimar.de
Infrastructure
Compute Resources
- Amazon EC2 GPU instance (g2.2xlarge – nVidia GRID K520: 1,536 CUDA cores, 4GB ram)
Data Acquisition
- Collect melodies from the datasets.
- The melodies are sampled with a musical axis in mind.
- The smallest sampling note is a sixteenth note - thus we sample barwise and map the note events to our grid of sixteenth.
- If a note is longer than a sixteenth note (which is usually the case), we have a continuity flag to model longer notes.
Datasets Used
We decided to use three separate databases in order to validate that the results we were getting related to the data that we used in training. We chose from different styles for that reason.
Rolling Stone 500 The Rolling Stone dataset was created by David Temperley and Trevor Declerc. They annotated both the harmony and melody for 200 of the top 500 Rock 'n' Roll songs from Rolling Stone's list.
Essen Folksong Database The Essen Folksong Database provides over 20,000 songs in digital format. We used a dataset of 6008 songs which are in the public domain.
Weimar Jazz Database The Weimar Jazz database provides a digital format of Jazz lead sheets.
Data Format
Pitch
Our pitch values are the standard midi roll, with a couple of exceptions. We decided to limit the range of pitches to three octaves, since we found that to cover the range of many songs. The pitches are also transposed to their C-Major-equivalent pitches.
Time
For the LSTM, we specified that each layer would represent the time unit of a 1/16th note. Therefore all of our musical onsets and durations were quantized to the nearest 16th note.
Meter
The Generative Theory of Tonal Music (Lerdahl and Jackendoff, 1984) provided the metric hierarchy that we utilized as part of our data format. They used a dot notation to specify the most important onset times within a measure.
An example of the metrical hierarchy in which the minimum beat is a 1/4 note (Lerdahl and Jackendoff, 1984, p. 19)
Because our minimum time unit was a 1/16th note, our metrical hierarchy looked more similar to the following:
An example of the metrical hierarchy in which the minimum beat is a 1/16 note. This hierarchy is identical to ours, however the example shows a song in 2/4, while we assumed 4/4 for each song's time signature. Therefore, ours is equivalent to the pictured hierarchy spanning two consecutive measures. (Lerdahl and Jackendoff, 1984, p. 23)
Harmony
Our harmony encoding simply consisted of a separate 12-unit vector with the pitch-classes of each tone that was part of the underlying harmony set to one. Our hope was that the LSTM would intuit that the harmony related to the melody in the same time slice.
The Essen folk song collection does not include harmony, only monophonic melodies. We added chords ourselves, using a simplistic approach. Namely, the chords change every measure (there is only one chord associated with each measure). We find the suitable chord by creating a pitch class histogram for a measure (which takes into account the duration of the notes that sounded in the measure) and finding the smallest cosine distance with a mask of 24 major and minor chord triads.
Encoding
With the pitch information, harmony information, and metrical hierarchy level for each slice of the song at every time unit, we created a matrix of boolean values which represented each feature in a vertical vector.
An example of one of the songs from David Temperley and Trevor Declerc's Rolling Stone 500 data set, after being formatted into a matrix of relative pitch values with their corresponding metric onset level (Note: harmony is omitted).
An example of one of the solos the Weimar Jazz Database (Note: harmony is omitted).
Here is an example. A song “Es flog ein klein Waldvogelein” is accompanied by chords (the long stripes under the melody are chords).
Another example of the rock corpus, the song “1999” by Prince. This time with harmony.
Neural Network
- We use LSTMs to incorporate temporal information.
- Pitch contours are combined with harmony information.
- The network is supposed to learn suitable melodies for certain chord changes.
- By giving the beat information, we hope that the network learns to play or don't play alteration or chord notes on certain beats.
Input Data Layer
- 36 Pitches (3 Octaves) to incorporate the melody.
- 1 Continuity flag per voice in the melody.
- 12 Pitch Classes (Chroma) with chord information.
- 5 levels of the metrical hierarchy.
Libraries Used
- Keras
- Theano
- music21
- SQL Alchemy
- NumPy
Results
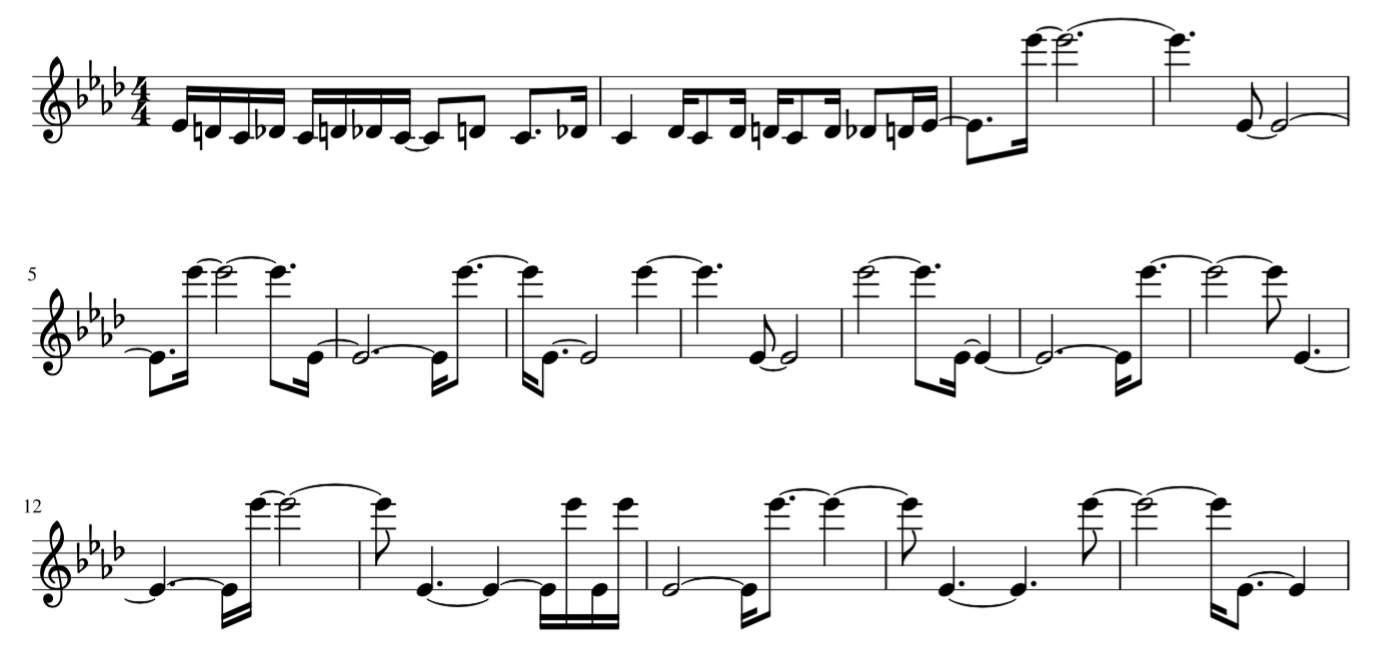
Train on ESAC, Random Seed
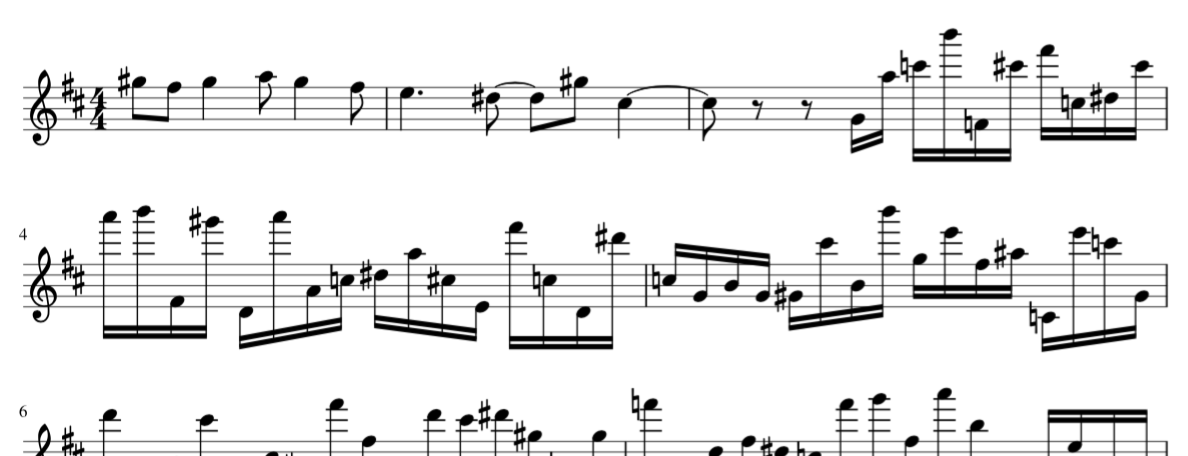
Train on ESAC, ESAC Seed, Probabilistic Sampling
Next Steps
- Try out longer training and more epoches.
- Integrate harmony components.
- Cross-learn: Learn on ESAC and harmony from jazz etc.


