User Tools
Table of Contents
Visualizing the Compositional Hierarchical Model
The Goal
The goal of this hack was to update existing visualization of compositional hierarchical model for spectral input data and provide some sort of visualization for symbolic input data.
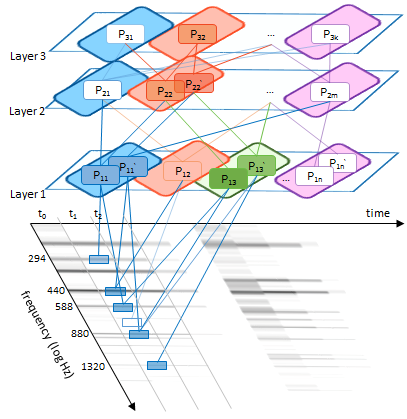
In theory, we wanted a model which works like this:
There are two previous visualizations of the compositional hierarchical model.
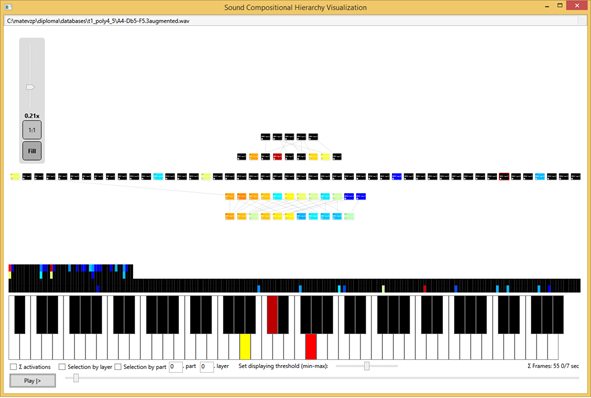
The original visualization might be good enough for the development, but lacks flexibility and responsiveness (its completely drawn with XAML components and GraphSharp Library). There's also another problem of this representation. Activation of each node is shown in jet colormap. Each node can have multiple activations which is not shown by this visualization (only the strongest activation is shown).
Thus, a second visualization was created for the spectral model some months ago (later extensions were put on a TODO list with no priority whatsoever). The rose pedals indicate the activations (magnitude equals to the size of the pedal) and their location in spectrum (clockwise).
Goal no. 1 - fix the issues of the current visualization
The first goal of this hack was to fix some graphic issues with the visualization, causing the application to consume too much memory. The second goal was to provide additional visualizations of connecting nodes across layers.
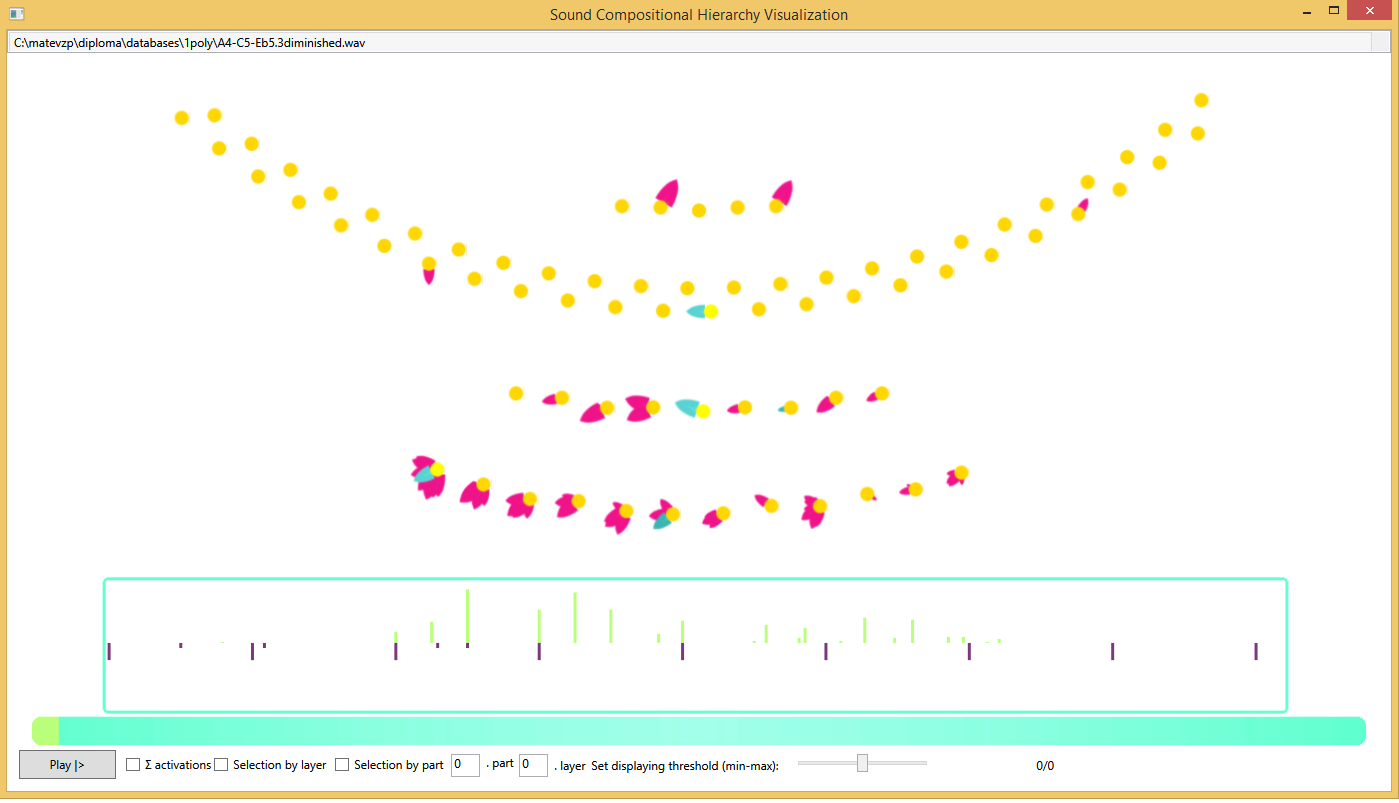
Besides the unvisible optimization issues resolved, the visualization now outputs the subtree of each node (marked blue in the Figure above).
Goal no. 2 - provide a new visualization for symbolic data
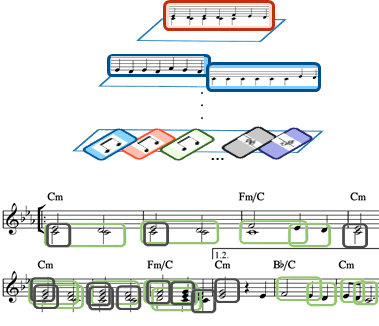
The second (but unfortunately unfinished) hack was to provide a visualization of symbolic data. Eventhough the XNA works great and all, the framework is no longer supported (and it only compiles for the x86 platform). Thus, I started working on a JavaScript prototype (using d3.js library) for visualizing the symbolic data. In theory, it should look like this (abstraction):
Unfortunately, this hack took more time of transforming the data than actually producing the results. Nevertheless, a (really abstract and simple) prototype has come to life :)
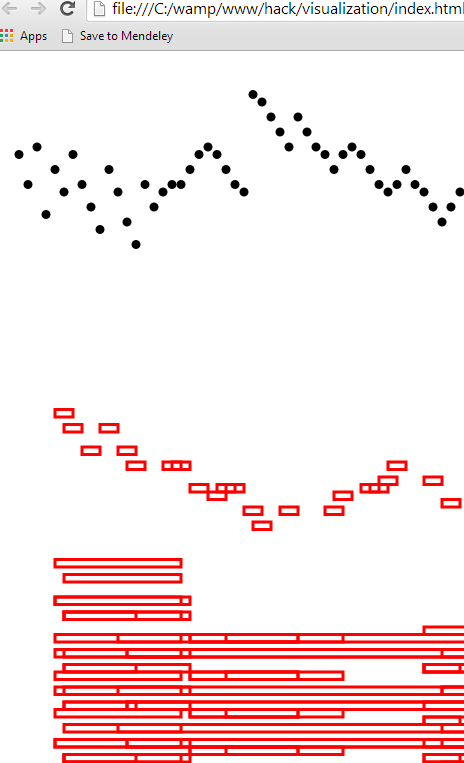
The black dots represent the MIDI note onsets, while the red squares represent the patterns. The patterns only represent the location and the length of pattern. For each layer of nodes in the model, a new “row” of patterns is formed (there are two layers shown in the Figure above).
The majority of the time was dedicated to the adjustment of the model and transformation of the data.
Future work (or TODO for the next hack day)
This hack still needs A LOT of work to become actually useful. Planned features are the following:
- observing occurrences by selecting a part, a layer, a subtree (composition of parts);
- developing a 3D visualization (and make it turnable) using d3.js;
- audio output - playing the selected patterns.
