In this demonstration, you will see how a computer "analyzes" sound, via
an image called a spectrogram.
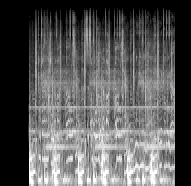
A spectrogram converts sound -- the rapid, tiny variation in air pressure
detected by your eardrums -- into variations in brightness (or color)
across the flat plane of an image.
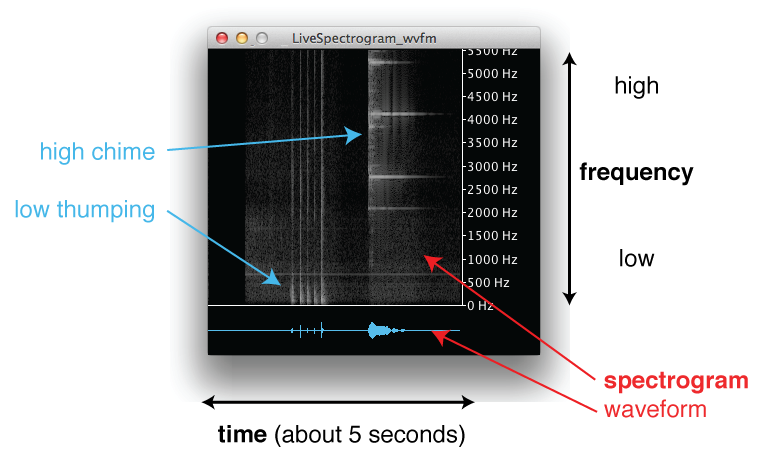
In the spectrogram image:
time is mapped to left-right position
the up-down axis denotes frequency
Hence, a low rumble appears as bright spots near the bottom of the image,
and a high-pitched whistle shows up as a stripe near the top of the image.
By comparing the spectrograms that you look at with
the sounds you hear, we learn about how the auditory
system -- the parts of your brain that deal with sound -- work:
The spectrogram roughly matches the information your ear feeds to
your brain.
By writing computer programs to tell apart sounds based on their
spectrograms, we improve our understanding of how brains do it.
What to do
Your computer should be set up to be running the LiveSpectrogram program,
which will show the spectrogram of any sound played by the computer.
(If it isn't, see these setup instructions).
Now you can go through the sounds listed below,
and think about the questions for each one.
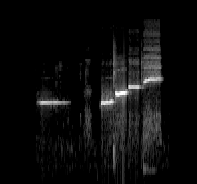
Whistle
This is a recording of me whistling:
What happens when the sound starts?
What is the difference between loud and soft sounds?
What is the difference between whistles with high and low pitch?
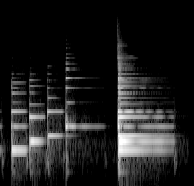
Instruments
Here are two different musical instruments playing the same notes as I whistled:
What is the same about the notes from two instruments? (And the whistle?)
What is different between them? How come we can tell them apart when we listen?
What happens when several notes are played at the same time?
These notes (C, E, and G) form a "C Major triad", one of the basic chords in musical
harmony. Do you notice anything special about the relationships between
the notes? (Maybe you can try some different note combinations.)
Voice
Here are some recordings of my voice:
The first recording has sounds that are all my voice at the same pitch,
but they are not identical. How do they differ?
The next recording is me counting. How can we tell each number apart?
The final recording shows how you can use your mouth to control the
spectrogram in different ways.
You can try this yourself by switching the spectrogram to listen to
the computer's microphone.
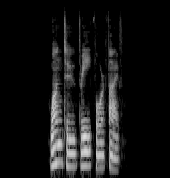
Music
Here are two excerpts from My Violent Heart by Nine Inch Nails:
How do sounds without a clear pitch (like drums) appear on
the spectrogram?
How does the rhythm appear?
Trent Reznor of Nine Inch Nails is very interested in sound
technology, and the "sound" at the end of the track was specifically
created for its appearance in a spectrogram. Can you relate the sound
to the image?